

The digital marketing landscape is experiencing a significant transformation, with social media advertising becoming an increasingly vital component of business strategies. According to Statista Market Insights, the Compound Annual Growth Rate (CAGR) of ad spending is expected to be 15.7% from 2017 to 2028, signaling a strong growth trajectory..
The Growth Trajectory of Social Media Advertising
The CAGR is a critical measure to understand the market’s growth pattern. It’s the mean annual growth rate of an investment over a specified time frame longer than one year, expressed as:
CAGR = (EV/BV)1/2 – 1
Where:
-
EV is the end value,
-
BV is the beginning value,
-
n is the number of years.
This calculation method helps us to recognize the consistent rise in social media advertising expenditures. It indicates not just a growing acceptance of social media as a key advertising medium but also reflects the increasing value that businesses place on this form of marketing. The steady increase suggests that companies are seeing a strong return on investment from social media ads, which is encouraging them to allocate more of their advertising budget to these platforms.
A Closer Look at the Figures
The ad spending data from 2017 to 2028 reveals a clear upward trend:
| Year | Ad Spending (in billion USD) |
|---|---|
| 2017 | 51.32 |
| 2018 | 73.28 |
| 2019 | 97.50 |
| 2020 | 132.77 |
| 2021 | 180.92 |
| 2022 | 189.50 |
| 2023 | 207.08 |
| 2024 | 219.80 |
| 2025 | 230.05 |
| 2026 | 238.85 |
| 2027 | 247.31 |
| 2028 | 255.78 |

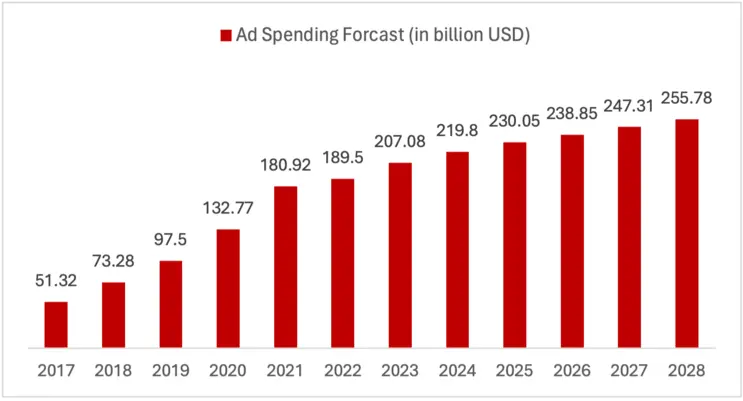
These figures are not just numbers; they represent the growing confidence of businesses in social media platforms’ ability to reach and engage with their target audiences. The data also suggests that as the internet becomes more ingrained in daily life, the potential for reaching consumers through social media will continue to grow.
The Asian and American Markets: Leading the Way
Asia and the United States are at the forefront of the social media advertising market, with Asia being the largest regional market and the United States leading among individual countries.
The regional and country-specific ad spending for 2023 and the projected growth by 2028 are as follows:
| Region/Country | Ad Spending 2023 (in billion USD) | Ad Spending 2028 (in billion USD) | CAGR |
|---|---|---|---|
| Europe | 81.81 | 100.23 | 4.1% |
| Africa | 4.05 | 4.86 | 3.7% |
| Americas | 30.11 | 36.06 | 3.7% |
| Asia | 90.02 | 113.26 | 4.7% |
| Australia & Oceania | 1.08 | 1.36 | 4.7% |
| China | 71.38 | 89.51 | 4.6% |
| United States | 72.33 | 88.08 | 4.0% |
| United Kingdom | 9.76 | 10.85 | 2.1% |
| Germany | 3.84 | 4.90 | 5.0% |
| France | 2.93 | 3.50 | 3.6% |

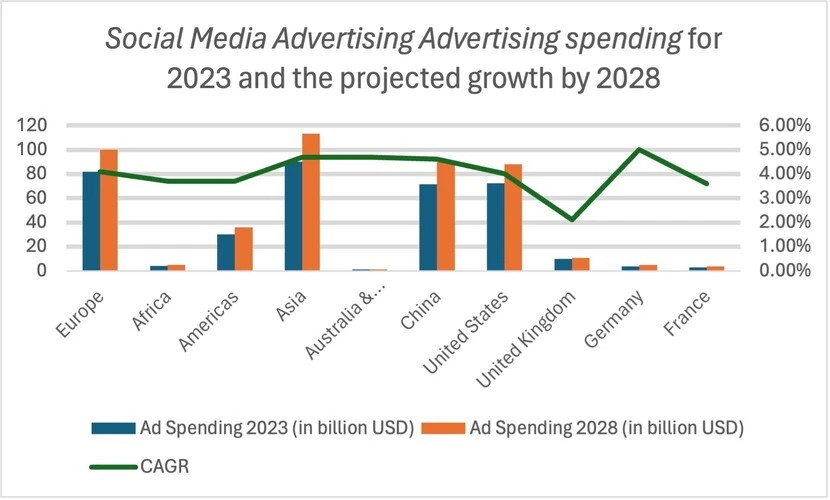
The prominence of Asia and the United States in these figures underscores the strategic importance of these markets for global advertisers. Asia’s significant share is driven by its large population and increasing internet penetration, while the United States’ market size is bolstered by high consumer spending and advanced digital infrastructure.
Average Ad Spending Forcast Per Internet User
An equally important metric is the average ad spending per internet user, which provides insight into the investment businesses are making to reach online audiences. From 2017 to 2028, there is a noticeable increase in this metric:
| Year | Average Ad Spending Per User (in USD) |
|---|---|
| 2017 | 14.36 |
| 2018 | 18.89 |
| 2019 | 22.93 |
| 2020 | 29.01 |
| 2021 | 37.28 |
| 2022 | 37.12 |
| 2023 | 38.84 |
| 2024 | 39.70 |
| 2025 | 40.20 |
| 2026 | 40.53 |
| 2027 | 40.88 |
| 2028 | 41.24 |

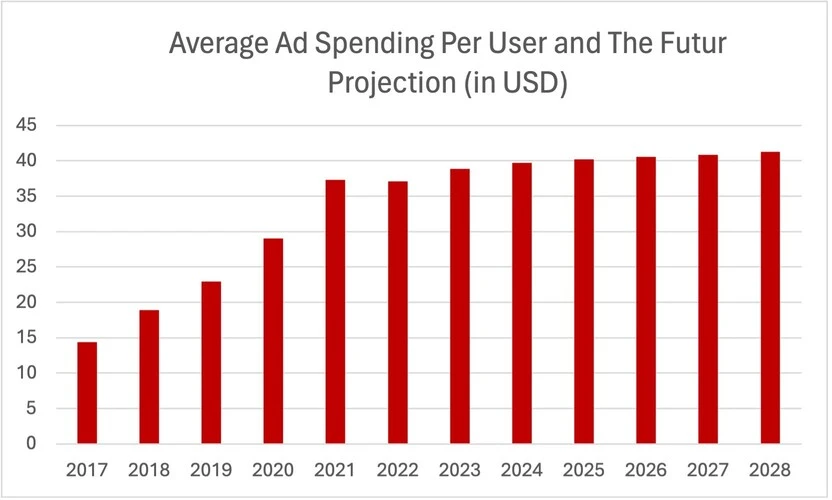
This trend suggests that as the internet population grows and becomes more engaged, the value placed on each user by advertisers is also increasing. It reflects the growing competition among businesses to capture the attention of internet users and the willingness to invest more in targeted and personalized advertising.
Conclusion
The comprehensive analysis of social media advertising highlights its effectiveness and the vast opportunities it presents. With significant growth in both regional and country-specific markets, and an increase in average ad spending per internet user, the industry is poised for continued innovation and expansion.